11 Useful Tools for Molecular Biologists to Bookmark Now
- Nima Sarfaraz

- Dec 3, 2023
- 7 min read
Updated: Jan 15, 2025
As a scientist, it can be hard to admit you sometimes have too many browser tabs open at once for your own good. The next step is learning how to organize them and the rest of your digital ecosystem, which I'll detail in a separate blog post. But unfortunately, today, I'm here to add on more portals, tools, and websites to the pile.
If you haven't heard of or tried any of these resources, I highly recommend you visit them and poke around some of their functionalities. The plethora of capabilities and use cases for each is far too wide to fully detail in the scope of this blog post, but most have tutorials and user guides available to check out. I've outlined some of the common tasks below and hope to introduce you to something new. As a disclaimer, I am not affiliated with nor paid by any of the services or companies tied to the suggestions below. All header texts in this post serve as hyperlinks to the homepage of each tool.
With that being said, let's dive in:


USCS In-Silico PCR is an essential tool for molecular biologists involved in gene sequencing, analysis, and plenty of PCRs. At its core, this tool allows researchers to simulate the PCR process in silico, using various genome databases as templates. This virtual approach saves invaluable lab time and resources by predicting amplicons before any actual reactions are in play. By inputting primer sequences, you can quickly determine the specificity and amplicon sizes of those primers against genomic sequences.
Ideal for tasks like:
Validating primer design
Checking for potential off-target amplicons
Using the USCS genome browser to explore different custom data tracks (e.g., ChIP-seq, transcription factor binding, RNA-seq read) in the genome view
Keep in mind that the reference genome assembly you select may influence your results based on the transcript annotations for each release, as well as what custom data tracks are available to use.

The IDT OligoAnalyzer Tool™ is a specialized tool designed by Integrated DNA Technologies for analyzing and designing oligonucleotides. It is an essential tool for verifying primers to be used in PCR, sequencing, and hybridization experiments, based on some of the core principles of good primer design:

Ideal for tasks like:
Melting Temperature (Tm) Calculation: Determine the melting temperature of your oligonucleotide for PCR and hybridization experiments.
Secondary Structure Prediction: Analyze potential secondary structures (like hairpins) that might impact the performance of oligonucleotides in experiments.
Dimer Analysis: Check for possible dimer formations, which are critical for the specificity and efficiency of PCR assays.
Molecular Weight Calculation: Quickly calculate the molecular weight of oligonucleotides, necessary for precise quantification in various applications.
You may need to create an account to use this service, but it's completely free.

The DNA Reverse Complement tool by VectorBuilder is straightforward and time-saving. It automates the process of finding the reverse complement of a DNA sequence, a fundamental step in many genetic and molecular biology analyses.
Ideal for tasks like:
Cloning and Sequencing: Essential for designing primers in cloning and sequencing experiments, where the reverse complement of a target sequence is often required.
Molecular Hybridization Studies: Facilitates the design of probes or oligonucleotides for hybridization techniques.
RNA Transcription Analysis: Useful in determining the complementary RNA sequence from a given DNA strand for transcription-related studies

GEPIA2 is a web-based tool designed for the analysis of RNA sequencing data from The Cancer Genome Atlas (TCGA) and Genotype-Tissue Expression (GTEx) projects. It's an advanced platform for gene expression analysis across a variety of cancers, offering a range of customizable functions complete with statistics.
Ideal for tasks like:
Gene Expression Analysis: Compare gene expression patterns across different cancer types and normal tissues (e.g., tumor vs. non-tumor)
Survival Analysis: Investigate the correlation between gene expression and patient survival rates.
Correlation Analyses Similar Gene Detection: Perform X vs. Y correlation analyses for the expression of two different genes, or identify genes with similar expression patterns.
Custom Data Query: Perform specific queries for gene expression data, tailored to individual research needs.
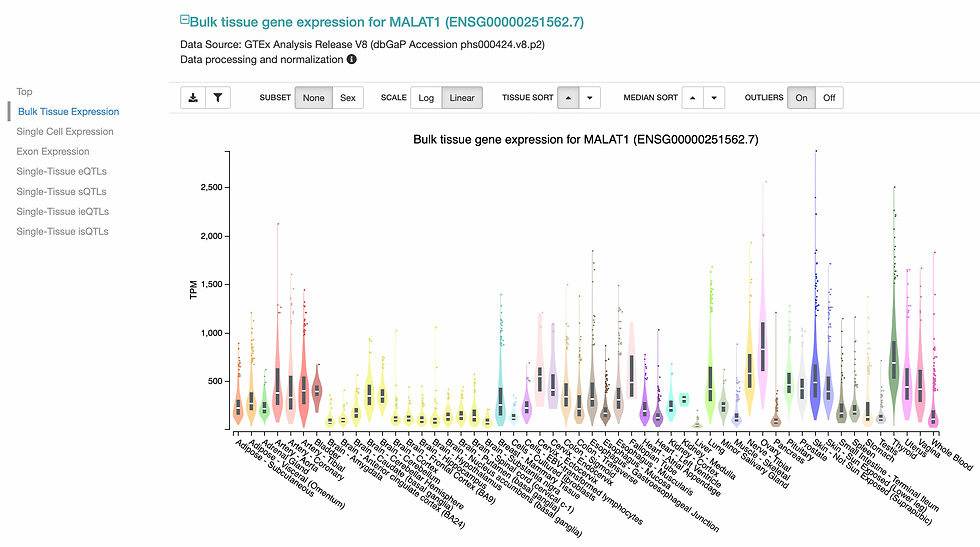
GTEx is a comprehensive public resource that studies tissue-specific gene expression and regulation in human tissues. It contains data from thousands of samples across multiple tissue types to help provide insight into genetic regulation and variations across the human body.
Ideal for tasks like:
Gene Expression Analysis: Explore how genes are expressed in different tissues (both bulk and single-cell) and in varying conditions.
eQTL Mapping: Identify expression quantitative trait loci (eQTLs), which help understand how genetic variants influence gene expression.
Comparative Studies: Compare gene expression across multiple tissue types to understand tissue-specific gene regulation.
6) Xena Browser

The Xena Browser is an interactive, web-based tool designed to visualize and analyze large-scale public genomic datasets, such as those from TCGA, ICGC, TARGET, and GTEx. It's tailored for researchers and clinicians who are delving into genomic data and its correlation with clinical outcomes.
Ideal for tasks like:
Cancer Genomics Analysis: Explore and analyze genomic data across various cancer types, including expression, correlation, and survival analyses.
Multi-Omics Data Integration: View and integrate different types of omics data (genomic, transcriptomic, proteomic, etc.) for a comprehensive analysis.
Patient Cohort Comparison: Compare the genomic profiles of different patient cohorts
Data Visualization: Utilize advanced visualization tools for a clear representation of complex genomic data
7) KM Plotter

KM Plotter is an online tool designed for survival analysis, particularly in the context of cancer research. It allows researchers to assess the effect of genes on survival using Kaplan-Meier survival plots, drawing on vast databases of gene expression and clinical data.
Ideal for tasks like:
Survival Analysis in Cancer Research: Utilize the tool to create Kaplan-Meier plots, exploring the relationship between gene expression levels and patient survival across various cancer types.
Gene-Prognostic Studies: Investigate the prognostic value of specific genes in cancer, aiding in the identification of potential therapeutic targets and biomarkers.
Comparative Oncogenomics: Compare the survival impact of different genes within and across cancer subtypes, enhancing understanding of cancer biology.

The GEO is a comprehensive public repository for storing and freely accessing high-throughput gene expression data, microarray data, and next-generation sequencing data. Managed by the National Center for Biotechnology Information (NCBI), it serves as a pivotal resource for researchers worldwide in the field of functional genomics.
Ideal for tasks like:
Data Mining: Access a vast archive of gene expression datasets for hypothesis generation and testing in diverse biological contexts, use for custom computing pipelines
Comparative Analysis: Compare and analyze gene expression across different studies, conditions, or organism types.
Molecular Profiling: Investigate the expression profiles of genes across various diseases, treatments, or developmental stages.
Meta-Analysis: Conduct meta-analyses using the repository's aggregated data to draw broader conclusions about gene expression patterns.

The Eukaryotic Promoter Database is a curated collection of transcription start sites (TSSs) from a wide range of eukaryotic species. It provides accurate and experimentally validated information on promoter sequences, making it an invaluable resource for researchers studying gene regulation and transcriptional mechanisms.
Ideal for tasks like:
Transcriptional Research: Investigate promoter sequences for insights into transcriptional regulation (ex., predicted transcription factors and their binding sites) and gene expression patterns in eukaryotic cells.
Gene Regulation Studies: Explore TSSs to understand the mechanisms of gene regulation in different eukaryotic organisms and under various conditions.
Comparative Genomics: Analyze promoter sequences across different species to study evolutionary conservation and diversity in gene regulation.
Functional Genomics: Utilize the database to annotate genomic sequences with promoter information, aiding in the identification of regulatory elements and their functions.
10) GeneCards

GeneCards is a comprehensive, user-friendly database that provides detailed information on all annotated and predicted human genes. It aggregates data from numerous genomic, proteomic, and transcriptomic resources, offering a comprehensive view of individual genes, their functions, and related biomedical information.
Ideal for tasks like:
Gene Research: Explore extensive data on gene expression, gene function, genetic variants, and interactions for individual human genes. Information about individual genes such as cell localization, aliases, and pathway enrichment.
Disease Association Studies: Investigate genes associated with specific diseases, facilitating research into disease mechanisms and potential therapies.
Molecular Pathway Analysis: Examine the involvement of genes in different biological pathways and processes.
Genetic Variant Annotation: Access information on genetic variants, including SNP data, to understand their potential impact on gene function and disease.
11) BioRender

BioRender is an online tool designed specifically for creating visually pleasing scientific diagrams and illustrations. It caters to scientists, educators, and students, offering an extensive library of pre-made icons and templates across various biological disciplines.
Ideal for tasks like:
Scientific Presentation Visuals: Create high-quality, professional diagrams for research presentations, lectures, and conferences.
Publication Figures: Design figures and schematics for scientific papers and journals that require precise and detailed illustrations.
Educational Material: Develop engaging and informative visuals for teaching biological concepts in classrooms or online courses.
Research Proposals: Enhance grant proposals and research plans with clear and attractive visual representations of proposed studies.
Note that while there is a free version available, premium features require a paid account. For other free options for high-quality vector art, make sure to check out NIH BioArt Source.

Comments